

COVID Investing
Investing through Covid-19 is confusing, but some things never change.
Read more →FOREXSTL
Investing through Covid-19 is confusing, but some things never change.
Read more →It has been a minute since I was hosted for a forex event as a guest speaker. This quarter pushed…
Read more →
The following is a book review of my key take-away lessons from chapters 13 to the end of one ofthe…
Read more →
HISTORIC ATTENDANCE & SPEAKING ENGAGEMENT AT AFRICA FOREX TRADING EXPO MARCH 2026 It has been a minute since I was…
Read more →
One of the hardest obstacles for people new into trading in the financial markets is in strategy development. Most people…
Read more →My day to day work entailed closing clients for automated trading expert advisors. This entailed tasks such as cold calling,…
Read more →Having worked from home for close to three years, it was about time that I stepped out of my comfort…
Read more →Sylvia’s Traders Lounge is delighted to give you a heads up on an up coming live interview with a question…
Read more →Just in case you’re wondering where we’ve been, we upgraded the site. Follow or reach out to us on https://forexstl.com/…
Read more →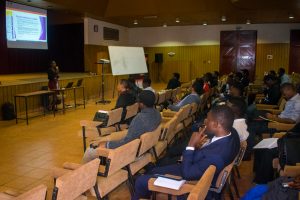
We just recently concluded seminars and a three day workshop with FXTM in Kenya. Strathmore University students actively participated as…
Read more →
I have said this before, brokers can be whores if they want to. One of the things that you should…
Read more →After a period of suppressed prices ( late 2017 up to the second quarter of 2018, Bitcoin is now positioning…
Read more →
This article is for the retail trader who wants to be in the game for the long haul, save yourself…
Read more →
Before using this site, please read the following prompts. Do Your Own Homework The content in this blog is intended…
Read more →“Performance comes, performance goes. Fees never falter.” (Warren Buffett. 2017 Berkshire Hathaway Investor Letter. Page 11) Let’s assume you’re ready…
Read more →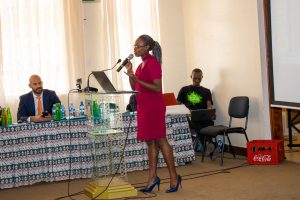
The year started with a bang after an invitation which was long overdue to speak to Kenyatta University students on…
Read more →Sylvia's Traders Lounge, established in February 2017, seeks to educate and provide trading advisory services to its members regardless of their level of experience and knowledge in financial markets.
To educate and provide key investment ideas to our members in Africa and beyond by participating in the financial markets.
Personalized educational and trading advisory services that enable our members to invest in the financial markets across the globe.
Disclaimer: Trading financial instruments on margin carries a high level of risk and may not be suitable for all investors as you could sustain losses in excess of deposits. Leverage can work against you. Be aware and fully understand all risks associated with the market and trading. Sylvia's Traders Lounge assumes no liability for errors, inaccuracies or omissions. The information shared on this platform is purely for educational purpose and should not be regarded as investment advice. Past performance is not indicative of future results.